Quantifying Risk
Risk is a difficult concept to communicate. Imagine a graph of a probability distribution, the tighter the graph the smaller the risk; while the wider the graph the greater the risk. What would be easier is a numeric way to communicate risk and fortunately statistics has one. In 4 simple steps we can calculate the Standard Deviation, σ
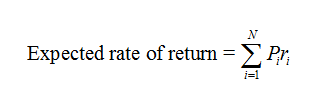
1st Calculate the Expected Rate of Return

2nd calculate the deviation of the possible outcomes 1 – N. Deviationi = Possible Outcomei – Expected Rate of Return

3rd Now Square each deviation and multiply it by the probability of its occurrence to calculate the variance.

4th Simply find the square root of the variance to find the standard deviation

Once we have calculated the Standard deviation we may want to look at the risk reward ratio. The coefficient of variation is the ratio of the standard deviation to the mean. The lower the CV the better the risk-return trade-off.
